

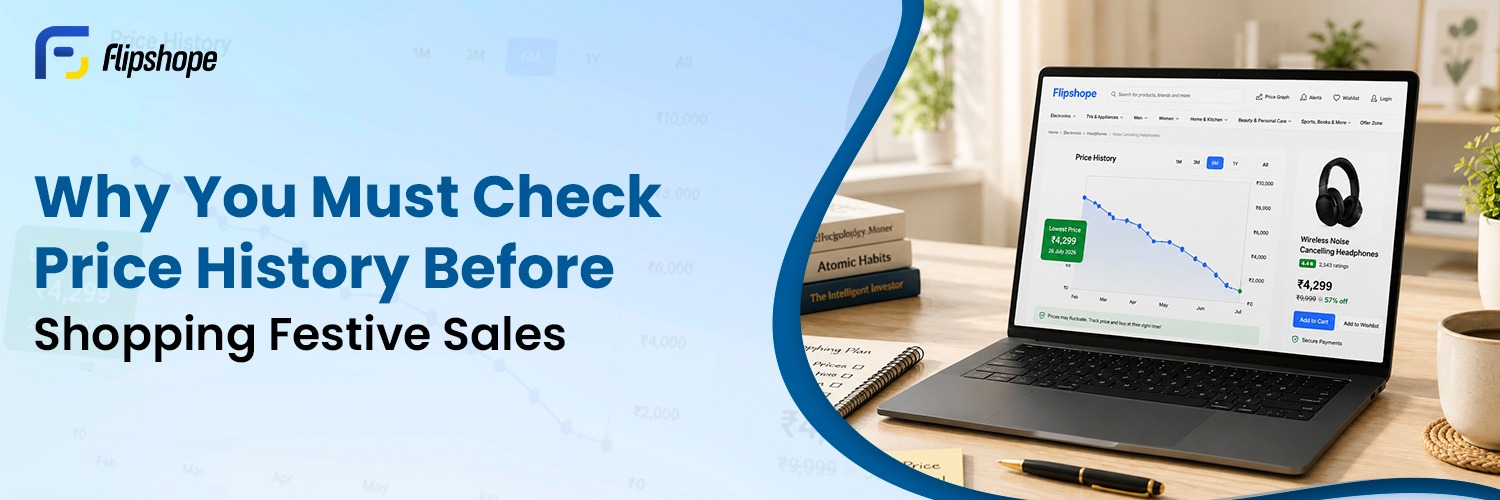
 You see “72% off” on a product during the Big Billion Days sale. You add it to your cart immediately. But what if that product was already priced lower six weeks ago, before the sale inflated it to make the discount look bigger?
Checking price history before any festive sale purchase is the single most effective way to confirm whether a deal is real or manufactured. This guide explains why dynamic pricing exists, how to track it, and how to use that data to avoid paying more than necessary rather than just feel like you did.
What Is Price History?
Price history is the recorded trail of price changes a product has gone through on a platform over a set time period, daily, weekly, monthly, or longer.
When you see a product listed at ₹5,999 with “was ₹19,999” crossed out, that crossed-out number may not reflect a recent actual price. It could be a reference price that was briefly set before a sale to create the appearance of a deep discount. Price history data exposes this.
Price history doesn’t predict future prices. Instead, it gives you context so you can judge whether today’s offer is genuinely competitive compared with previous pricing.
A price-tracking tool logs every time a product’s price changes. When you pull up the history chart before buying, you can see whether the current sale price is genuinely lower than usual or just lower than an inflated pre-sale markup.
How Dynamic Pricing Works During Festive Sales
Major Indian platforms like Flipkart and Amazon use dynamic pricing algorithms that adjust product prices in real time based on demand signals, competitor data, inventory levels, and promotional windows.
During festive seasons, this creates a predictable pattern :
| Phase | What Happens to Price |
| 4-6 weeks before sale | Price is raised to create a new “original price” reference |
| 1-2 weeks before sale | Price stays high or drops slightly |
| Sale goes live | “Discount” is calculated from the inflated reference |
| During sale | Price may actually be similar to or higher than pre-inflation levels |
| After sale | Price often returns to or near what it was before the inflation cycle |
Platforms operate within legal limits, but the presentation of discounts is designed to create a sense of urgency. Without price history data, you have no context for whether the sale price represents genuine savings.
Many shoppers assume a larger discount automatically means a better deal. In reality, the percentage matters far less than knowing what the product has actually sold for over the past few months.
Practical takeaway: Never trust the crossed-out “MRP” or the percentage badge alone. The number that matters is the lowest price the product has actually sold for in the past 90 to 180 days.
What a Price History Chart Tells You
A price history chart gives you three critical pieces of information:
- The actual lowest price: You can see the floor, the cheapest the product has been on that platform and compare it to today’s sale price. Looking at the lowest recorded price also helps set realistic expectations. If a product has never dropped below ₹18,000, waiting for ₹12,000 is unlikely to be worth your time.
- How stable the price is: If a product fluctuates wildly between ₹3,000 and ₹9,000 week to week, it’s likely managed by a heavy algorithm, and you should wait for a genuine dip. If it’s been steady around ₹4,500 for months and now shows ₹3,800, that’s likely a real deal.
- Whether the discount timing is predictable. Some products drop in price consistently during certain months. Price history lets you see those patterns and plan your purchase accordingly.
How to Check Price History Using Flipshope
Before buying any product during a festive sale, it’s worth taking a minute to check its price history. Instead of relying only on discount badges, you can see how the price has changed over the past few months and decide whether today’s offer is genuinely worth it.
Option 1: Browser Extension (Desktop)
- Install the Flipshope browser extension for Chrome or Edge
- Open the product page on Flipkart or Amazon
- The extension automatically overlays a price history chart directly on the product page
- Review the price history from the last 6-12 months and compare today’s price with previous prices before making a purchase
Option 2: Website Price Tracker
- Go to flipshope.com and use the search or paste the product URL
- Flipshope pulls the current price, the price history graph, the all-time low, and the average price
- Use this data to decide whether to buy now or wait
- If the current price is close to the historical low, it may be a good time to buy. If not, you can wait for a better opportunity.
Option 3: Track Future Price History With Price Drop Alert
- If the current price is still higher than you’re willing to pay, set your preferred price
- Flipshope sends you a notification when the price reaches that price
- You buy only when the price actually hits a level you’re comfortable with, not because a sale countdown is pressuring you
Real Example: What Price History Reveals
Say you’re looking at a pair of wireless earphones priced at ₹2,499 during a Flipkart sale, advertised as 58% off, down from ₹5,999.
The Flipshope price history chart shows:
- The product was at ₹5,999 for only 9 days before the sale
- For the 4 months before that, it was consistently priced between ₹2,199 and ₹2,399
- The all-time low on Flipkart was ₹1,999 in February
In this case, the current sale price of ₹2,499 is actually slightly higher than what you’d have paid most of the year. The “58% off” badge is technically accurate, but the reference price was set for the sale.
Without the price history data, you’d assume you’re saving ₹3,500. With it, you know to wait or look elsewhere.
This is why experienced online shoppers rarely make buying decisions based only on the discount badge. They compare today’s price with previous prices before deciding whether the deal is actually worth taking.
Which Products Benefit Most From Price Tracking?
Price tracking matters more for some categories than others:
- Smartphones and laptops: high-margin items with frequent algorithmic price changes
- Headphones and audio gear: prices fluctuate significantly around launch and sale cycles
- Televisions and large appliances: significant variance between sale and non-sale pricing
- Branded fashion and footwear: genuine clearance events versus manufactured discounts are hard to tell apart without historical data
For consumables, groceries, and fast-moving daily items, price history is less relevant because margins and patterns differ.
Tips to Shop Smarter During Festive Sales
- Start tracking 6 to 8 weeks before a major sale. Set your alerts early so you have a baseline to compare against.
- Check the all-time low, not just the recent trend. A product at its 90-day low might still be above its 12-month low.
- Don’t let flash sale countdowns rush you. A 2-hour countdown is designed to encourage quicker purchase decisions. Price data removes emotion from the decision.
- Compare across platforms. Flipshope covers multiple platforms, so you can check whether the same product is cheaper on one than another during the same sale window.
- A product that’s expensive on one platform isn’t necessarily expensive everywhere. Comparing prices across Amazon and Flipkart often reveals better deals, especially during overlapping sale events.
- Stack price data with cashback. Knowing the real lowest price tells you the best time to buy. Once you decide to buy, running it through a cashback platform on top of the sale price is the final layer.
Festive Sale Buying Checklist
- Check the product’s price history
- Compare the same product on Amazon and Flipkart
- Look at the all-time low price.
- Apply available bank offers.
- Activate cashback before checkout.
- Read recent seller reviews.
- Set a price alert if today’s price isn’t attractive
Conclusion
Festive sales are a genuine opportunity to save on products you actually want, but only if the discount is real.
Price history gives you enough context to make a better decision. Instead of reacting to sale banners, you’re working from data. You see whether ₹3,800 is a real deal or just lower than a temporary markup. You know when to buy, when to wait, and when the deal isn’t as good as it looks.
Use Flipshope’s price tracker before the next Big Billion Days or Great Indian Festival. Set your alerts now, check the history when the sale opens, and if the price history supports today’s offer, it’s usually a good time to buy.
Frequently Asked Questions
Q1. What is price history in online shopping?
Price history is the complete record of how a product’s price has changed over time on a platform. It shows every price change, the date it occurred, and the all-time high and low. Checking this before a sale confirms whether the current discount reflects a genuine price reduction.
Q2. Why do prices increase before festive sales?
Platforms use dynamic pricing algorithms that sometimes raise prices before a sale event to create a higher reference point. When the “sale” launches, the percentage discount may look large, but compared to the product’s normal price, the savings may be minimal or nonexistent.
Q3. How accurate is the Flipshope price tracker?
Flipshope pulls price data directly from product pages on Flipkart and Amazon at regular intervals. The charts reflect actual recorded prices from those platforms. As with any tracker, there may be short gaps if a price changes between scans, but the data is reliable for identifying trends and genuine all-time lows.
Q4. Can I track prices for any product on Flipkart?
Flipshope supports price tracking for most products listed on Flipkart and Amazon in India. You can search by product name, paste a product URL, or use the browser extension to load the chart automatically on any product page you visit.
Q5. Does setting a price alert cost anything?
No. Flipshope’s price alerts and price history tools are free to use. Create an account, search for your product, set your target price, and you’ll receive a notification when the price drops to that level.
Q6. Is it better to buy during a sale or wait for a price drop alert?
It depends on the product and the data. If the current sale price is at or near the all-time low shown in the price history, buying now makes sense. If it’s still above the 12-month average or has historically been lower outside of sale events, a price drop alert lets you wait for a better moment.